Cartopyで地理データを可視化する2
cartopyにはNatural Earthで公開されているshapeファイルデータを使うためのモジュールが実装されている。Natural Earthのデータを使って地図を描いてみた。
海岸線を描画する
GeoAxes.coastlines()を使えば、作成したGeoAxesクラスの地図にNaturalEarthの海岸線データを描画することができる。NaturalEarthの海岸線ベクトルデータを使用している。解像度は3種類ある。
import matplotlib.pyplot as plt
import cartopy.crs as ccrs

plt.figure(figsize=[15,5])

## 110m resolution (default)
ax1 = plt.subplot(1, 3, 1, projection=ccrs.PlateCarree())
ax1.coastlines(resolution='110m')
ax1.set_extent([120,150,20,50], ccrs.PlateCarree())
ax1.set_title('110m coastline')

## 50m resolution
ax1 = plt.subplot(1, 3, 2, projection=ccrs.PlateCarree())
ax1.coastlines(resolution='50m')
ax1.set_extent([120,150,20,50], ccrs.PlateCarree())
ax1.set_title('50m coastline')

## 10m resolution
ax1 = plt.subplot(1, 3, 3, projection=ccrs.PlateCarree())
ax1.coastlines(resolution='10m')
ax1.set_extent([120,150,20,50], ccrs.PlateCarree())
ax1.set_title('10m coastline')

様々なベクトルデータを描画する
| keyword | description |
|---|---|
| edgecolor/ec | 境界線の色 |
| facecolor/fc | 塗りつぶしの色 |
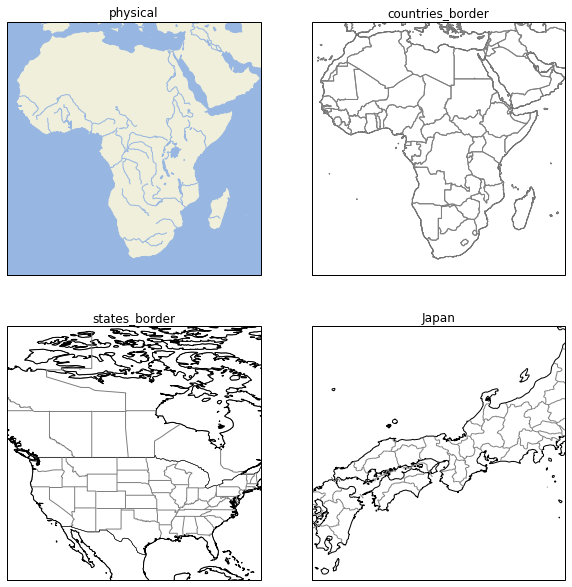
cartopy.feature.NaturalEarthFeatureを使うと、NaturalEarthのデータをダウンロードしてポリゴンを作ることができる。作成したポリゴンをGeoAxesに追加すればいい。
使い方は、
NaturalEarthFeature(category, name, scale, **kwargs)
で作成する。引数のcategory, name, scaleは、NaturalEarthのカテゴリ、データセット名、解像度に対応している。詳細はNaturalEarthのダウンロードのページを参照。
例えば、
NaturalEarthFeature('physical', 'land', '50m')
の場合は、「download/50m/cultural/ne_50m_land.zip」がダウンロードされて描画される。
import matplotlib.pyplot as plt
import cartopy.crs as ccrs
import cartopy.feature as cfeature

plt.figure(figsize=(10, 10))

# physical category
land_50m  = cfeature.NaturalEarthFeature('physical', 'land', '50m',
                                         edgecolor='face',                   # same color with facecolor
                                         facecolor=cfeature.COLORS['land'])  # use predefiend color of cartopy
ocean_50m = cfeature.NaturalEarthFeature('physical', 'ocean', '50m',
                                         edgecolor='face',                   # same color with facecolor
                                         facecolor=cfeature.COLORS['water']) # use predefiend color of cartopy
lakes_50m = cfeature.NaturalEarthFeature('physical', 'lakes', '50m',
                                         edgecolor='face',                   # same color with facecolor
                                         facecolor=cfeature.COLORS['water']) # use predefiend color of cartopy
river_50m = cfeature.NaturalEarthFeature('physical', 'rivers_lake_centerlines', '50m',
                                         edgecolor=cfeature.COLORS['water'], # use predefiend color of cartopy
                                         facecolor='none')                   # no filled color

# cultural category
countries_50m  = cfeature.NaturalEarthFeature('cultural', 'admin_0_countries', '50m',
                                              edgecolor='gray',
                                              facecolor='none')  # no filled color

states_50m  = cfeature.NaturalEarthFeature('cultural', 'admin_1_states_provinces_lines', '50m',
                                           edgecolor='gray',
                                           facecolor='none')  # no filled color

states_10m  = cfeature.NaturalEarthFeature('cultural', 'admin_1_states_provinces_lines', '10m',
                                           edgecolor='gray',
                                           facecolor='none')  # no filled color

ax1 = plt.subplot(2, 2, 1, projection=ccrs.PlateCarree())
ax1.set_extent([-20, 60,-40, 40], ccrs.PlateCarree())
ax1.add_feature(land_50m)
ax1.add_feature(ocean_50m)
ax1.add_feature(lakes_50m)
ax1.add_feature(river_50m)
ax1.set_title('physical')

ax2 = plt.subplot(2, 2, 2, projection=ccrs.PlateCarree())
ax2.set_extent([-20, 60,-40, 40], ccrs.PlateCarree())
ax2.coastlines(resolution='50m')
ax2.add_feature(countries_50m)
ax2.set_title('countries_border')

ax3 = plt.subplot(2, 2, 3, projection=ccrs.PlateCarree())
ax3.set_extent([-130, -70, 20, 80], ccrs.PlateCarree())
ax3.coastlines(resolution='50m')
ax3.add_feature(countries_50m, edgecolor='k', linewidth=0.5)
ax3.add_feature(states_50m)
ax3.set_title('states_border')

ax4 = plt.subplot(2, 2, 4, projection=ccrs.PlateCarree())
ax4.set_extent([130, 140, 30, 40], ccrs.PlateCarree())
ax4.coastlines(resolution='10m')
ax4.add_feature(states_10m)
ax4.set_title('Japan')

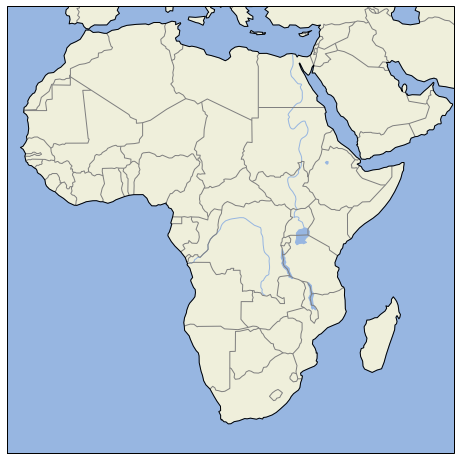
110m解像度のデータの一部は簡単に読み込めるように実装されている。
| Name | Description |
|---|---|
| cartopy.feature.BORDERS | 国境線。 |
| cartopy.feature.COASTLINE | 主たる島を含む海岸線。 |
| cartopy.feature.LAKES | 湖。 |
| cartopy.feature.LAND | 大陸と主たる島。 |
| cartopy.feature.OCEAN | 海洋。 |
| cartopy.feature.RIVERS | 河川。 |
import matplotlib.pyplot as plt
import cartopy.crs as ccrs
import cartopy.feature as cfeature

plt.figure(figsize=(8,8))

ax = plt.axes(projection=ccrs.PlateCarree())
ax.add_feature(cfeature.LAND)
ax.add_feature(cfeature.OCEAN)
ax.add_feature(cfeature.LAKES)
ax.add_feature(cfeature.RIVERS)
ax.add_feature(cfeature.BORDERS, edgecolor='gray')
ax.add_feature(cfeature.COASTLINE)

ax.set_extent([-20, 60,-40, 40], ccrs.PlateCarree())

